|
|
|
Topview ICE B - In Circuit Emulator for Atmel 8051 Microcontrollers

Topview In Circuit Emulator is the low cost emulator supporting many of Atmel 8051 microcontroller derivative devices in 40 and 20 pin counts. The Topview ICE comes with a state of art Integrated Development Environment enabling the users troubleshoot the application software and the hardware in real time with ease and confidence. The IDE has built-in program editor, device template generator and the debugging facilities. The emulator has the facility to debug source level debugging facilities for both C and ASM programs. Other features like on line assembler, dis-assembler, software trace, break point options make the emulator very much versatile for very complicated applications.
In short, the Topview ICE is the advanced development tool that will reduce the project time to a large extent enabling the designers undertake more projects than before.
Features:
- Supported Devices: Atmel 8051 Microcontrollers with on chip flash memory in a single chip mode.
- Real time operations upto 24MHz.
- Operating clock options: The emulator uses either built in clock or any other clock source connected with the target microcontroller. The built in clock oscillator generates a range of clock options: 4 MHz, 4.608 MHz, 8 MHz, 9.216 MHz, 10 MHz, 12 MHz, 16 MHz, 18.432MHz, 20 MHz and 24MHz.
- 5V operation.
- Supports upto 60 KBytes of Program Memory.
- Supports upto 256 Bytes of internal Data Memory.
- Supporting both 20 and 40 pin DIP devices.
- Connected with PC through USB port.
- Topview IDE runs under WinXP environment.
Supported
Devices:
- AT89C1051
- AT89C1051U.
- AT89C2051.
- AT89C4051.
- AT89C51.
- AT89C51RC
- AT89S51.
- AT89C52.
- AT89S52.
- AT89C55.
- AT89C55WD.
- AT89S53.
- AT89S8252.
- AT89S8253
Software Facilities:
Emulation Memory: Topview ICE - B provides 60 Kbytes of space for the program memory.
Software BreakPoints: Software BreakPoints allow the real time program execution until the specific program line.
Conditional BreakPoints: A set of conditional breakpoints permit the program halting during the emulation based on specific code address, source code lines and the register contents.
Language and file formats: Topview ICE - B accepts files with many formats. It also accepts different assemblers and C languages. For the ASM program, Intel Hex format is accepted. For the C environment, both KEIL and SDCC compilers are supported.
Source Level Debugging: The Topview IDE comes with a Source Level Debugger which helps the designers debug the application code generated by both the assembler and the C language. This debugger includes the commands to generate all the required information during the program and hardware testing in real time. The commands permit setting breakpoints based on high level language lines, adding a watch window with symbols and variables of interest, modifying the variables, executing assembly steps and many more useful functions.
Topview IDE - Integrated Development Environment

This is the device selection window. From here, you select the device, operating frequency, project type and project directory.
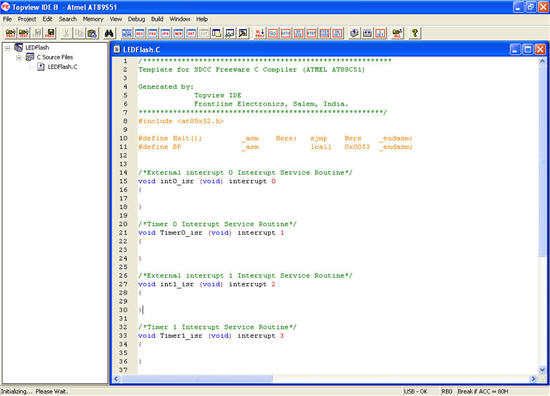
Template created by Topview IDE for the selected device compatible to SDCC C compiler.
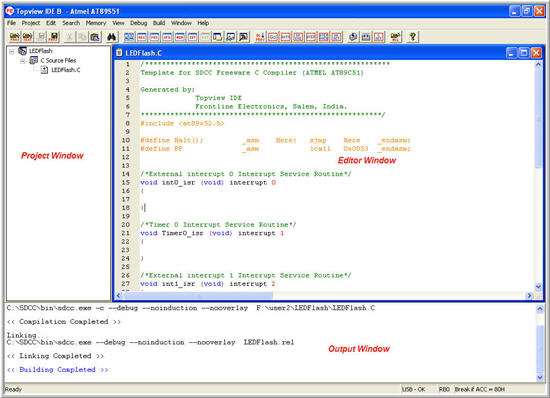
This is the arrangement of windows to write a program and compile the same. The Project window shows the files in the
project. You edit or type your program in the editor window and the Output window will show the output of the compiler. Editor window supports color syntax facility to make the programs easy to understand.

Topview IDE has 5 windows to show the internal details of 8051 controller.
1. Program Window - Shows the disassembly view of flash memory.
2. Register Window - Displays the internal register and it's contents.
3. Internal Memory Window - Shows the contents of Internal Data Memory.
4. Memory Bit Status Window - In this window the 128 memory bits status are displayed.
5. SFR Bit Status Window - The bit wise contents of the SFRs are displayed here.

This is the ClearView mode of Topview IDE. In this mode of viewing, all the details of the controller are brought out in a screen. This mode is very useful while debugging the program in assembly language.

This is a sample window placement on the screen while debugging a C program.
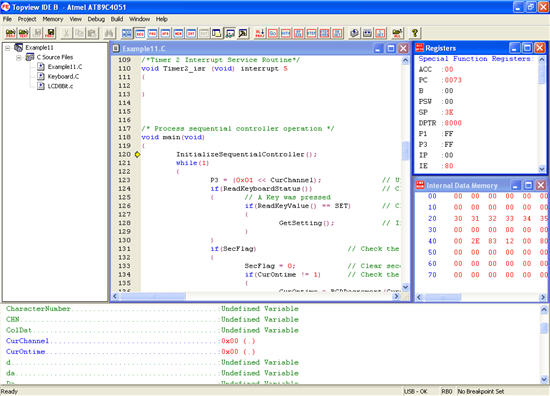
This is an another windows arrangement on the screen. Here the PC value is shown in the editor by a yellow color arrow. The current DPTR selected is shown using a red color arrow in the register window. In the bottom, the variables in the current project are displayed in the watch window. You can edit the values of the variables here. The active variables are displayed in blue color and the inactive variables are indicated in green color.
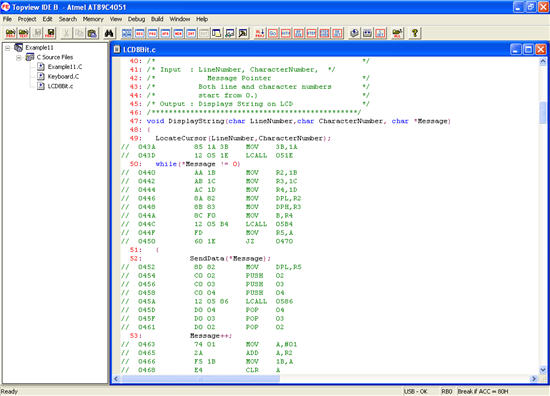

This is the mixed mode viewing of the both c and assembly language in a single window.
This is an another view of both assembly and C language programs. The contents of the flash memory is disassembled and displayed in the program window and in the editor window, the c program with it's corresponding assembly code is displayed in a single window.
|
|

Why
In Circuit Emulator
is Required?
l Find Bugs
Faster.
When more than half of the product development cycle consumed by debugging, finding bugs faster means your product will get to the market first..
l
ICE is a Powerful tool.
Only an In Circuit Emulator allows you to examine the state of the controller in which the application is running. In fact, the ICE actually takes the place of the target controller in your hardware. It is a powerful tool with tight debugging facilities, nothing else will help you get the job done better.
l
Ship your next product faster.
Topview ICE has facilities to pin point the elusive bugs in minutes, instead of hours or days and enables you to find every bug with ease and confidence. So that shipping your next products with known problems becomes a thing of the past!
l Get a Complete view on program flow.
The ICE is the only development tool that enables you to get a complete view on the program flow in real time. Since ICE runs at full speed many hard to find race conditions between software and hardware will show up when using ICE.
l Get Situation in your Control.
With ICE, you get the power and control to stop the program flow at the doubtful places and look into details to weed out bugs in real time. Since the ICE does everything in real time, you get all the operating details without any distortion and delay.
l More Projects = More Money.
Since you find out bugs in real time, ICE saves a lots of development time. In other words, you finish more applications in the given time.
l Become a Professional Designer.
Equipping your facilities with an ICE makes you a true professional designer. Professional designers have right development tool to undertake complex applications and finish them faster than others. Only
amateurs let the problems haunt them for long time without any clue on the finishing time. They let the situation go beyond their hands and keep trying with just guess work and end up frustrated to finish the project in haste. Amateurs never get enough time to finish their projects with satisfaction!!
l Best combination of hardware and software
tools.
Topview ICE is the complete tool with all the required hardware and software development facilities to complement your ingenuity to finish your next applications without any pain.
l Affordable Cost.
The cost of the Topview ICE is kept at the lowest level to motivate the professional designer in your mind to get one for yourself. As you can understand and appreciate,
the cost is very much less than one month salary of the system designer in India!
|
|